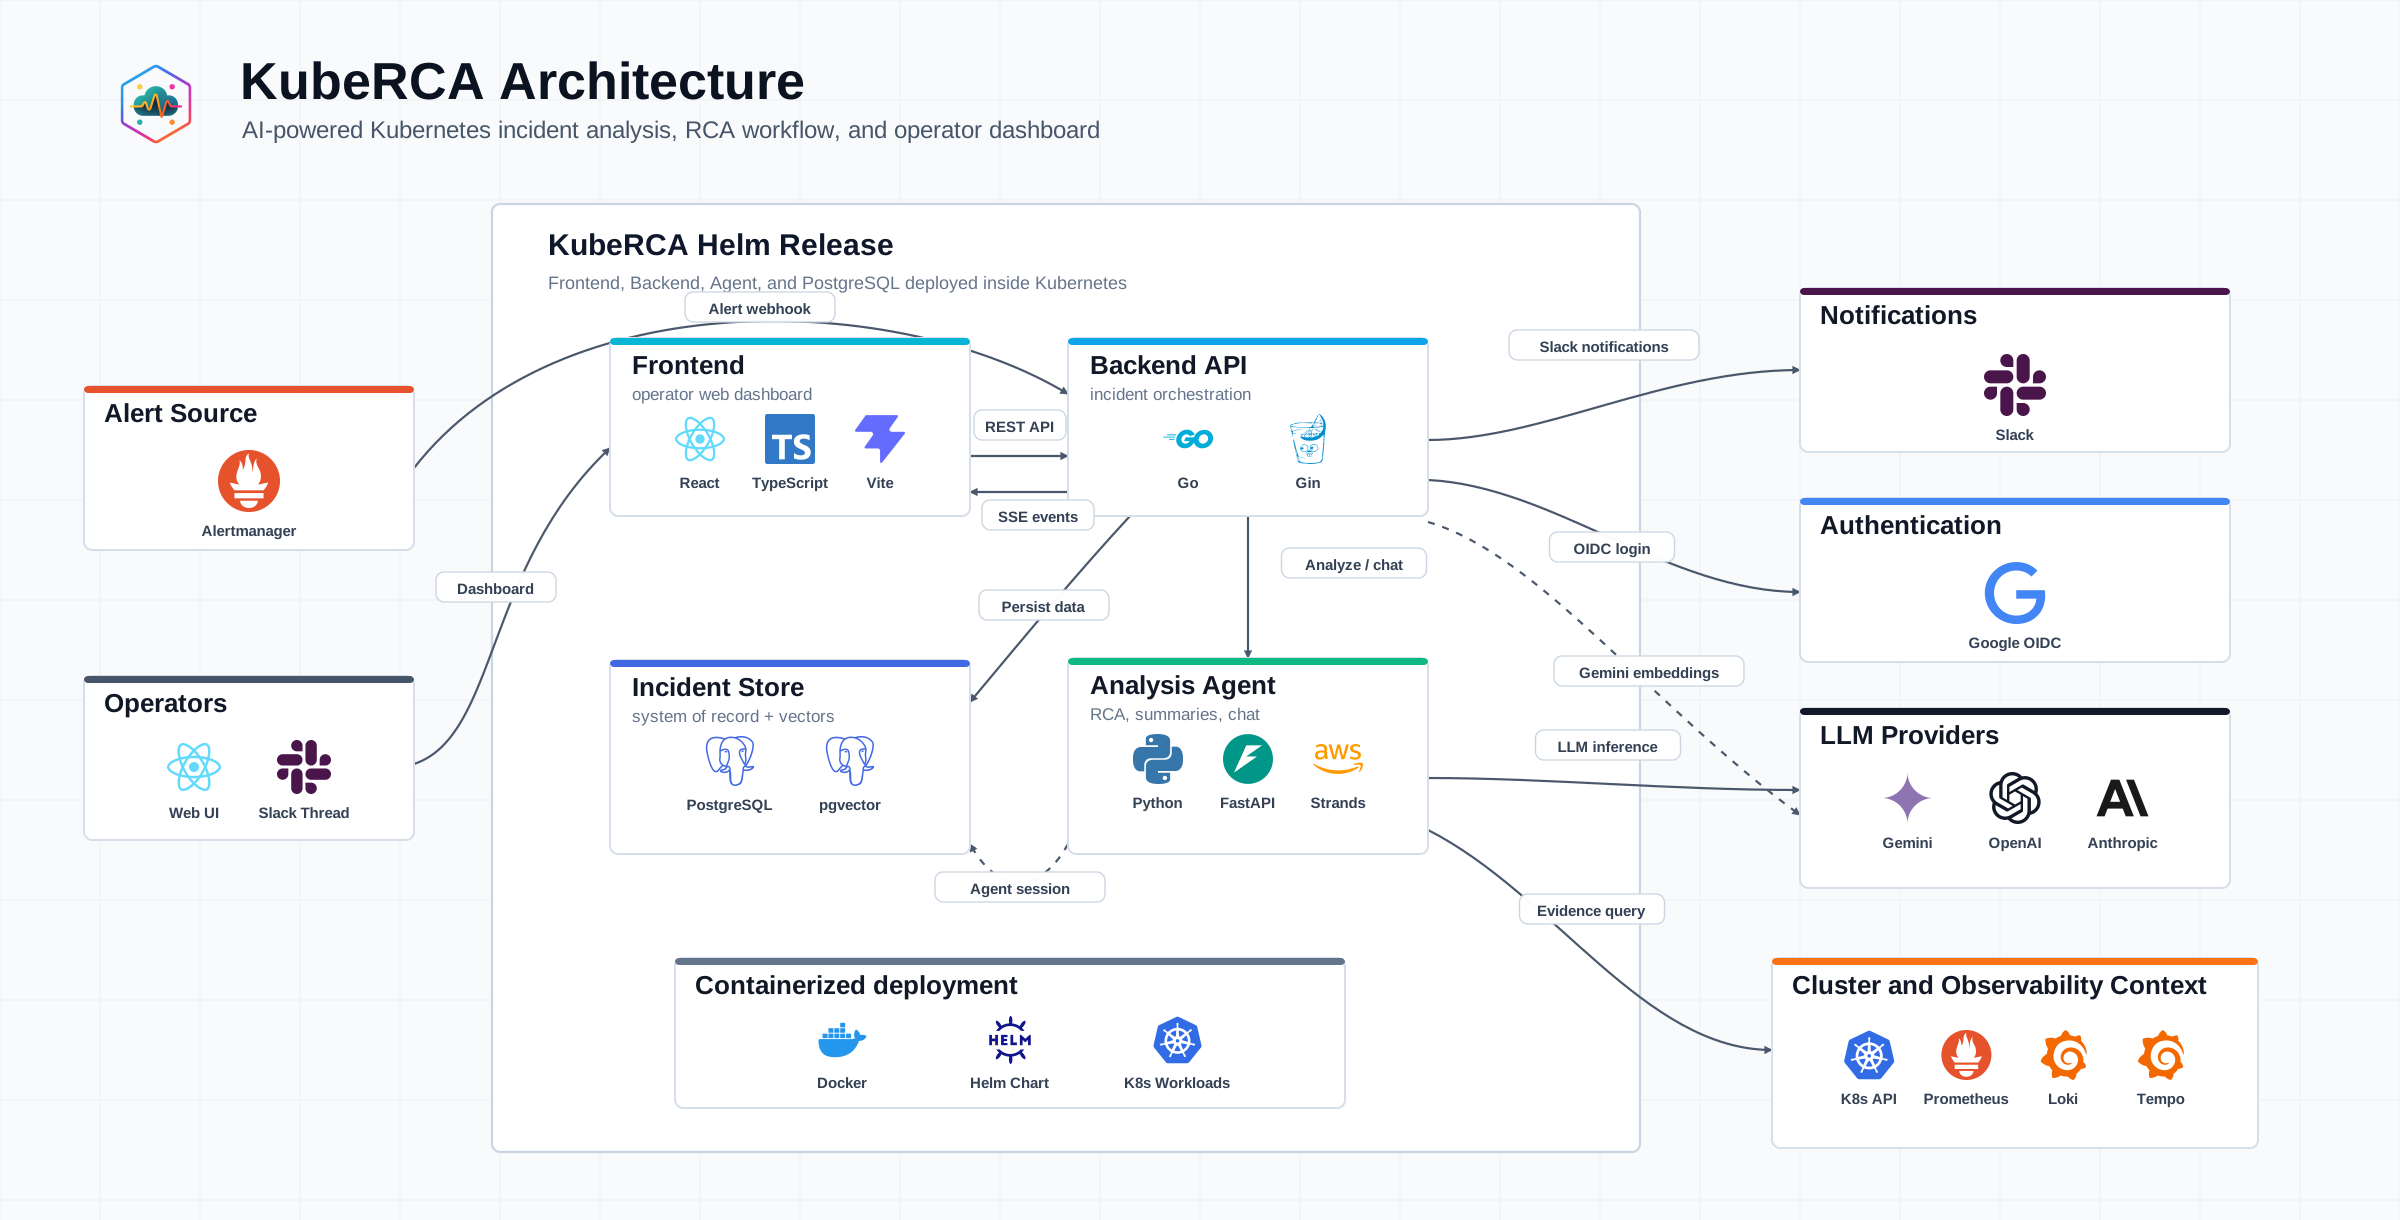
Operating a GPU platform changed my view of Kubernetes. I initially saw it primarily as a reliable place to deploy applications and run Pods. Once GPUs, queues, projects, and quotas enter the system, Kubernetes becomes the junction where resource allocation and organizational priority meet.
The change is visible in investigations that begin with kubectl get pods and quickly stop making progress. Pod state is an important starting point, but it is not the entire user-visible problem. The same Pending state can come from physical GPU shortage, fragmentation, taints and affinity, project quota, queue priority, or changing demand. Kubernetes contains several of those clues, but an operator still needs to connect them to policy and user impact.
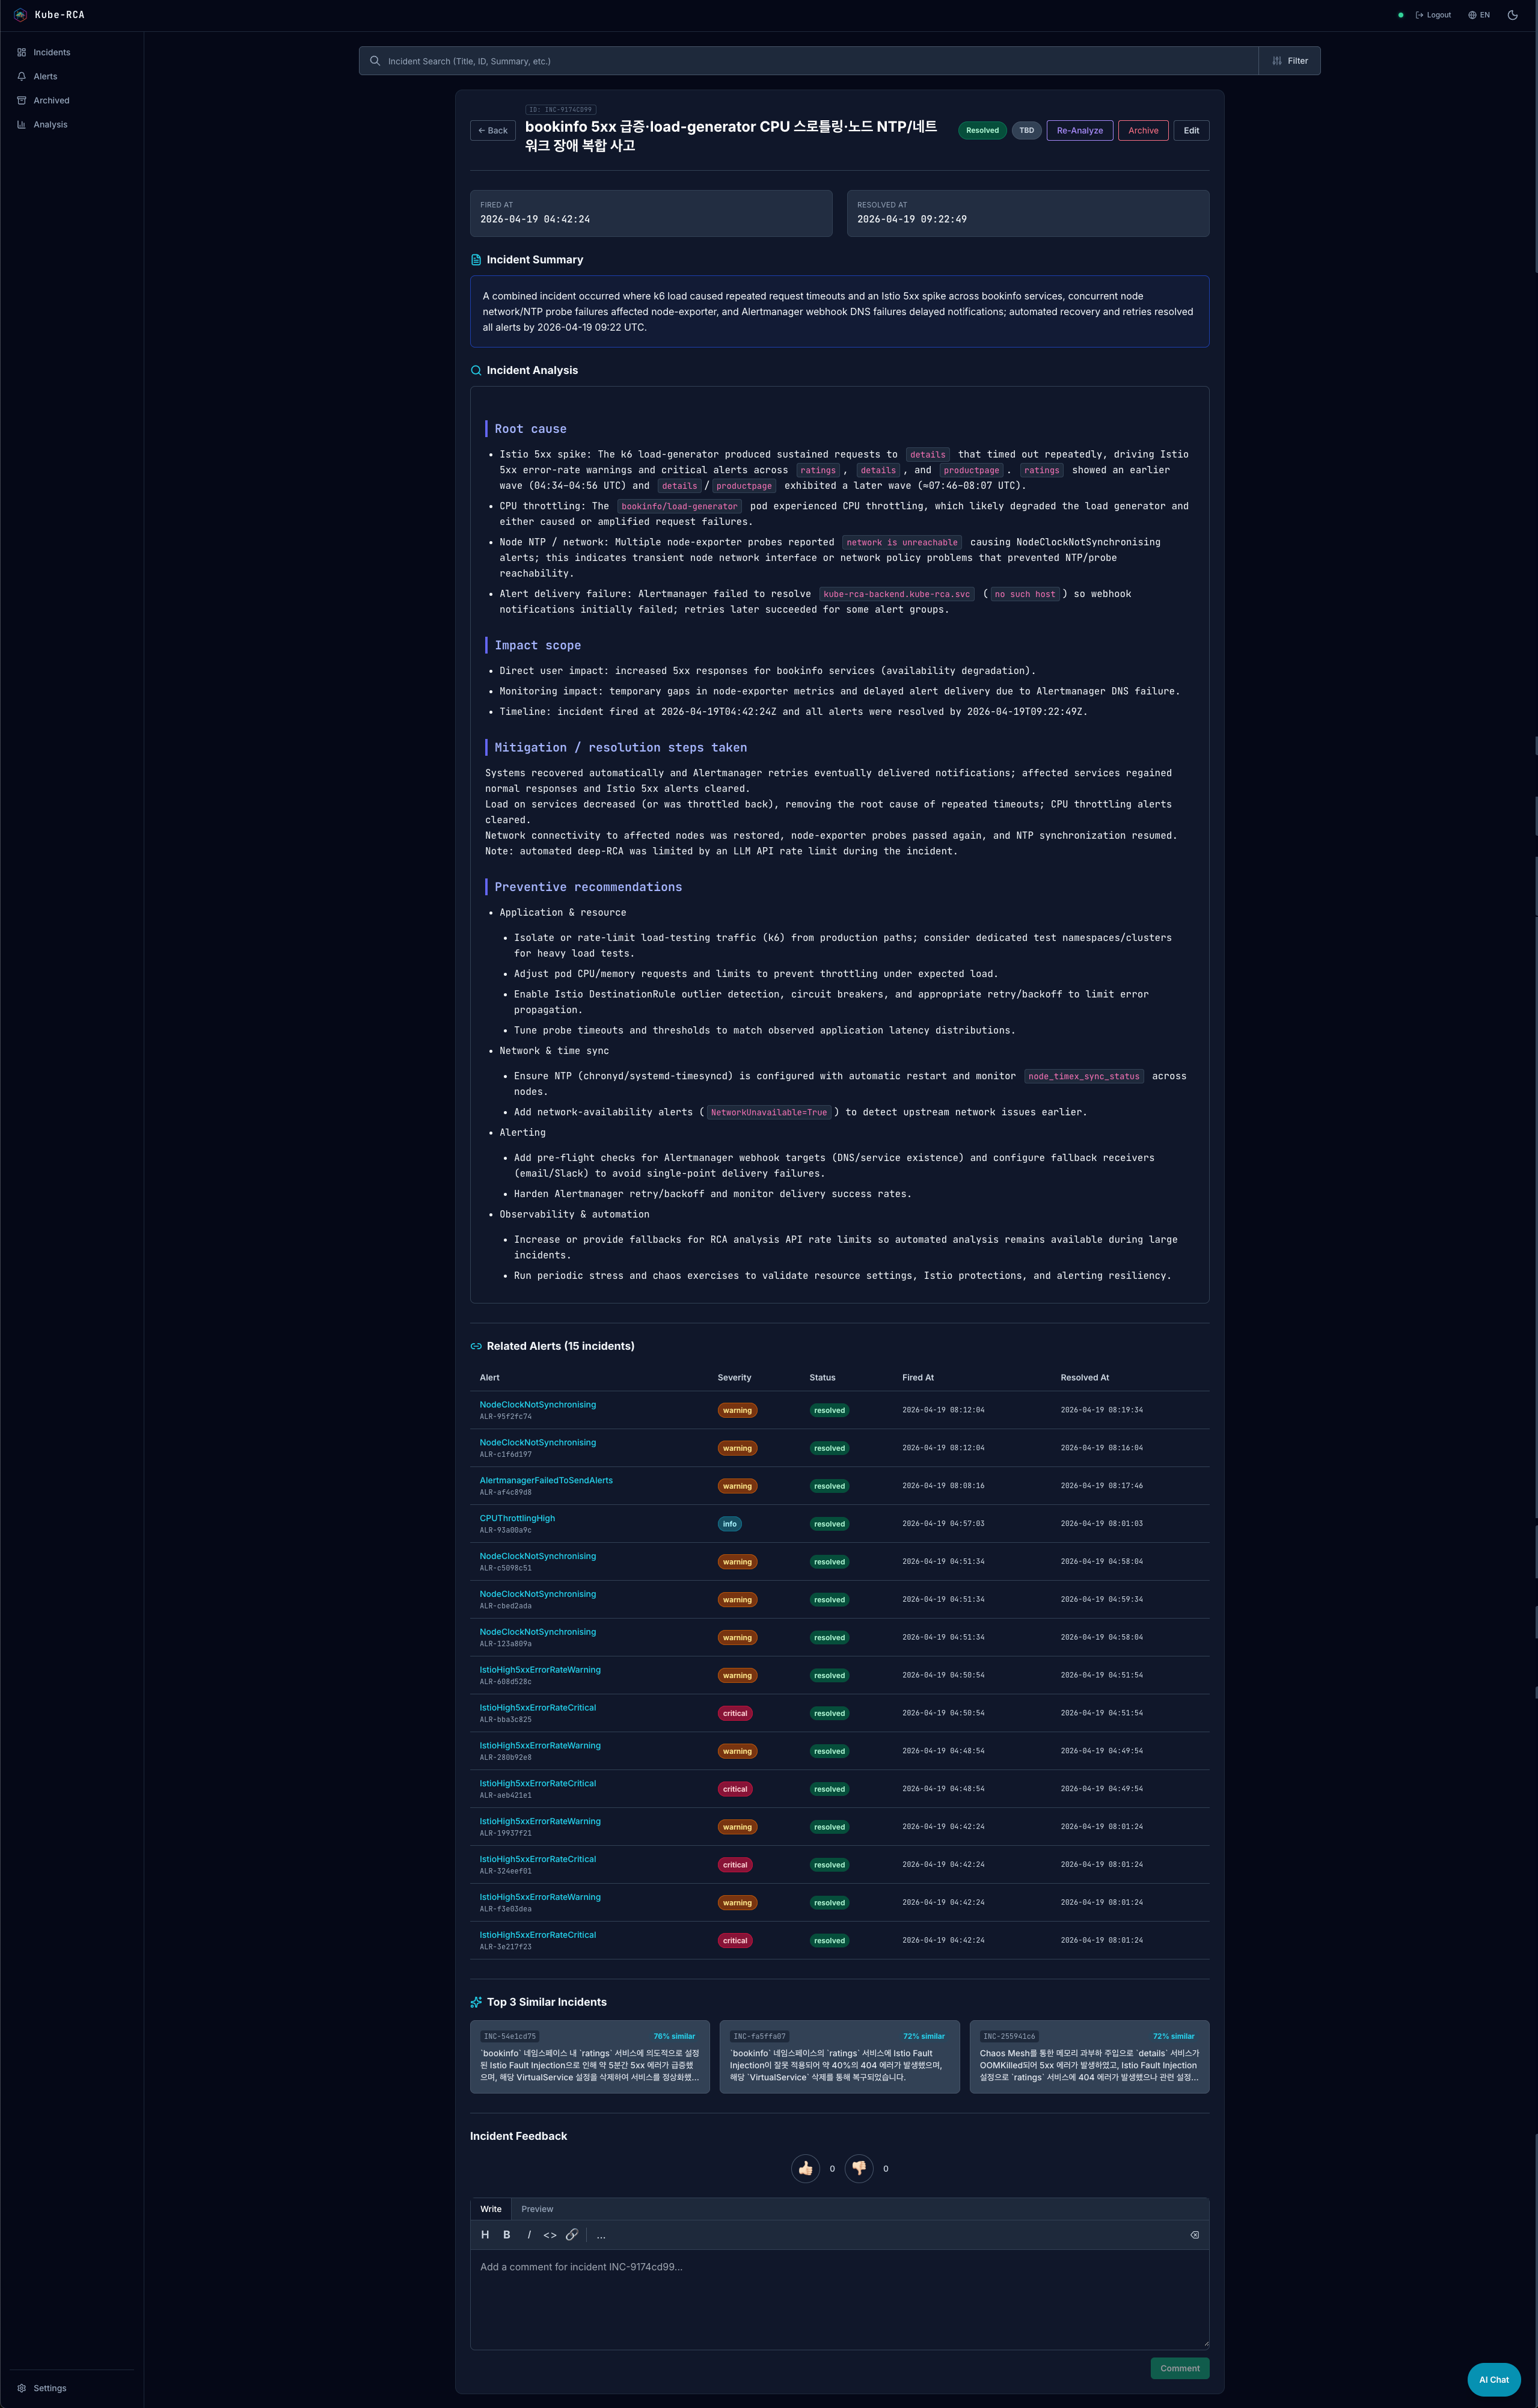
An example of reading Pod, node, and policy clues in one event record rather than rebuilding the investigation across consoles.
Scheduling is a policy outcome
A Pending Pod is easily described as a scheduler problem. For a GPU workload, request size, accelerator state, project quota, priority, and queue policy can all shape the result. Explaining why it was not placed requires more than one event line.
The same GPU changes the platform experience depending on who receives it, under which priority, and for how long. A scheduler decision is therefore both a technical state and the outcome of an organizational allocation policy.
Without that context, an operator can treat a workload delayed in a queue as an error, or investigate a quota-limited request as a node failure. The event may be correct while the explanation remains incomplete.
A resource request is also a product promise
In a CPU-oriented service, requests and limits can feel like deployment details. A single GPU request affects another team’s experiment start time, cost, and experience of project priority.
An excessive request can change the wait time for an entire queue. An undersized request may let a workload start while causing poor throughput, memory pressure, or repeated termination. The configuration belongs to one Pod, but its consequence belongs to a shared platform.
The platform should therefore explain why a request was accepted, waiting, or rejected. Kubernetes events and scheduler decisions need to be read with node availability and Run:ai project and queue policy. “No GPU is available” is rarely enough; an operator should be able to name the current blocker and explain which users a change could affect.
Node readiness does not prove GPU health
A Ready node does not guarantee that the GPU path required by a workload is healthy. The investigation may need to verify driver state, device-plugin registration, allocatable GPU count, memory or hardware errors, communication between devices, and imbalance across cards.
The inverse is also true. Low GPU utilization does not necessarily mean useful idle capacity. Jobs may be waiting on quota, affinity, a particular GPU model, memory shape, or an allocation strategy that leaves fragmented resources.
GPU observability is therefore better treated as a question-driven path than as one dashboard. Begin with the alert and workload, move to project and queue policy, then inspect node and GPU telemetry and relevant changes in the same window. The number of screens matters less than the distance between one clue and the next.
Observability must move across layers
When a GPU dashboard and a Kubernetes event view are isolated, the operator joins them mentally. A better experience lets one signal lead to the related workload, node, project, queue, and change history.
From an alert, an operator should be able to ask:
- which project and job are affected;
- which resource shape the job is waiting for;
- what changed in node, queue, or quota state at the same time;
- whether another workload or policy decision shares the blast radius.
The goal is not to place every graph on one page. It is to preserve the path to the next evidence source. An incident boundary can connect Kubernetes resources, GPU telemetry, platform policy, and change history without replacing the depth of each underlying tool.
Automate the operator’s repeated questions
The first step in automation is not “which command should run?” It is “which questions do operators repeat?”
When a GPU job is waiting, the common questions include its project and queue, requested resource shape, eligible node constraints, quota and priority, and recent changes. Once the questions are explicit, the required Kubernetes objects, platform APIs, and telemetry become clearer.
KubeRCA and Run:AI RCA treat Kubernetes as one source in that investigation rather than the only source of truth. They attach alerts to incidents, gather resources, events, metrics, logs, policy, and changes through read-only paths, and form hypotheses only from attributable observations.
The useful automation is not an automatic delete or restart. It is placing disconnected evidence in one time window and reducing how many questions the next operator needs to reconstruct.
Safe automation starts with safe questions
Automation does not need to begin with executing remediation. Reading current state, preserving evidence, and proposing a check that a person can verify is a safer first step.
This matters particularly on a GPU platform, where one aggressive action can affect expensive resources and several users at once. Run:AI RCA follows the same principle: Kubernetes is not a layer that hands the AI a verdict, but one of several evidence planes needed to explain a platform incident.
What operators should expect from automation
GPU automation is risky when measured by how quickly it can offer a restart button. A safer system gathers state through read-only access, shows which policy and observation support a recommendation, and records the impact and rollback of a possible action.
The ability not to overstate confidence is itself a feature. When an expensive shared resource is involved, a confident but unsupported action can cost more than a slower, reviewable investigation.
Keep Kubernetes as the shared operational language
Kubernetes is one system among several in a GPU platform, but it provides common identifiers: workload, Pod, node, namespace, and event.
A useful incident record connects those identifiers to user impact, GPU state, policy decisions, and change history. Another on-call engineer can then revisit the same objects and time window instead of being asked to trust an undocumented conclusion.
That is the core shift in perspective. Kubernetes is more than the layer that starts Pods. It is a junction where allocation outcomes and investigation facts can be connected to policy, observability, and human review.
Translate platform experience into SLOs
This perspective changes operational measures as well. Healthy-node count and average GPU utilization are not enough. A platform should also ask whether requested workloads start within a reasonable time, whether wait reasons are explainable, and whether the incident process preserves enough evidence for the responsible team.
Queue time, allocation failure reason, restart experience, and interruption are part of platform quality because they sit between technical state and user experience.
A GPU-platform SLO can therefore be a set of investigable promises rather than one number:
- workload state and wait reasons are visible;
- a policy-blocked user can identify a next action;
- incident evidence remains available for review;
- recovery can be verified without hiding its impact on other teams.
Seeing Kubernetes as the junction for these promises pushes observability beyond infrastructure health toward delivered operating quality.
A change may begin outside Kubernetes
A GPU workload can change state because of something outside cluster objects: Run:ai project policy, queue priority, quota, an image tag, data location, or changing user demand.
An incident timeline therefore needs more than deployment and configuration history. It should align platform-policy changes and user impact with Kubernetes state.
This is not about expanding blame. It changes the question from “which component broke?” to “which constraint and change produced the current user experience?” When policy is causal, a Kubernetes event cannot explain the full incident. The policy scope, intent, and affected projects are part of the evidence required for a safe correction.
Recovery is part of the platform promise
Restarting a Pending workload or clearing a queue may look like a fast resolution, but the impact on other users and priorities still matters. Before acting, an operator needs to record what will be affected, what should improve afterward, and how to reverse the change when the result is unexpected.
For an expensive shared resource, recovery procedure is part of product experience. A trusted platform does not only start jobs quickly; it also explains and safely changes the conditions under which they run.
The perspective change is therefore not about using more tools. It is about connecting state, policy, user impact, and change history inside one incident, while requiring evidence, impact, and rollback from every proposed action.
Handoff needs the same incident boundary
An on-call handoff should not require the next person to collect the same GPU-platform facts again. The event record needs target project, queue, quota, recent changes, tested hypotheses, and missing evidence alongside Pod state.
With that context, the next operator is not forced to trust the previous operator’s intuition. They can follow sources and timestamps and continue the judgment themselves.
Kubernetes resources and events remain the center of that shared language. Even when GPU telemetry and policy systems live elsewhere, workload, node, and namespace provide the connection between user impact and technical state. That is why GPU platform operations made me view Kubernetes as much more than an execution layer.
Comments